In this tutorial I show you a quick and easy way to debug your Java web application that is run by the Tomcat Maven plugin. There are just two short steps to this. Let’s see them.
Set up debugging options for Maven
You have to supply the required properties to Maven, so IDEA can connect to you app white it is running. This can be done by setting the MAVEN_OPTS environment property to
-Xdebug -Xrunjdwp:transport=dt_socket,address=4000,server=y,suspend=n -Xmx4g -Xms4g -XX:MaxPermSize=1g
Note here, the value 4000. This is the port that we are using for remove debugging. When you start your app with the Maven Tomcat plugin, you should see something like this, that means, the app is listening for remote debugging connections:
...
Listening for transport dt_socket at address: 4000
...
Configuring remote debugging in IDEA
For this you have to add a new Debug configuration that can be done by selecting the Run -> Edit configurations menu item. Here click the plus sign, to add a new configuration and select Remote.
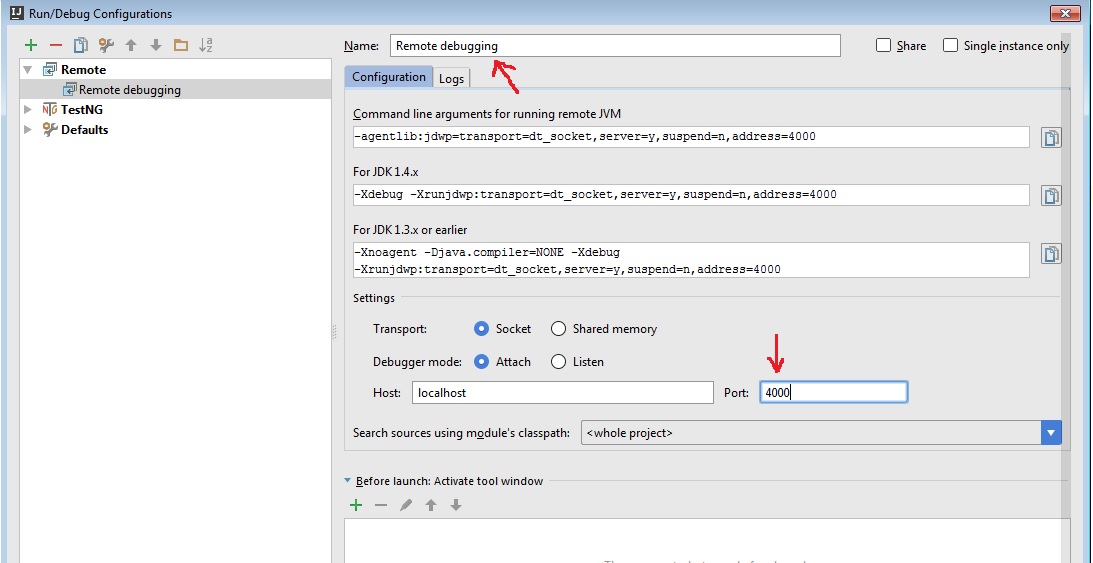
The new Remote debugging configuration is immediately created. You can give it a name, and set the port to 4000. Here is an image about how I set it up:
After you configured it, click OK, select the created configuration and start debugging with the green button that resembles a bug.
You are all set. You can add breakpoints and debug your running app remotely.
What’s with the -Xnoagent -Djava.compiler=NONE options?
You may see that in some places the remote debugging configuration contains the
-Xnoagent -Djava.compiler=NONE
options as well. These options were only required for very old JVMs so you can forget about them now.


